What a great article summarizing the optimization of perl scripting. Take a look here:
http://www.flirble.org/~nick/P/Fast_Enough/
Or Quoted here:
* When perl is not quite fast enough
*
o Introduction
o Obvious things
o Compromises
o Banish the demons of stupidity
o Intermission
o Tests
o What causes slowness
o Step by step
o Small easy things
o Needless importing is slow
o regexps
o Devel::DProf
o Benchmark
o What causes slowness in perl?
o Ops are bad, m'kay
o Memoize
o Miscellaneous
o yay for y
o Ops are bad, m'kay
o How to make perl fast enough
When perl is not quite fast enough
This is the script for my talk at YAPC::EU::2002. It's not a transcript of what I actually said; rather it collects together the notes that were in the pod source to the slides, the notes scribbled on various bits of paper, the notes that were only in my head, and tries to make a coherent text. I've also tried to add in the useful feedback I got - sometimes I can even remember who said it and so give them credit.
The slides are here, and hopefully it will be obvious where the slide changes are.
Introduction
So you have a perl script. And it's too slow. And you want to do something about it. This is a talk about what you can do to speed it up, and also how you try to avoid the problem in the first place.
Obvious things
Find better algorithm
Your code runs in the most efficient way that you can think of. But maybe someone else looked at the problem from a completely different direction and found an algorithm that is 100 times faster. Are you sure you have the best algorithm? Do some research.
Throw more hardware at it
If the program doesn't have to run on many machines may be cheaper to throw more hardware at it. After all, hardware is supposed to be cheap and programmers well paid. Perhaps you can gain performance by tuning your hardware better; maybe compiling a custom kernel for your machine will be enough.
mod_perl
For a CGI script that I wrote, I found that even after I'd shaved everything off it that I could, the server could still only serve 2.5 per second. The same server running the same script under mod_perl could serve 25 per second. That's a factor of 10 speedup for very little effort. And if your script isn't suitable for running under mod_perl there's also fastcgi (which CGI.pm supports). And if your script isn't a CGI, you could look at the persistent perl daemon, package PPerl on CPAN.
Rewrite in C, er C++, sorry Java, I mean C#, oops no ...
Of course, one final "obvious" solution is to re-write your perl program in a language that runs as native code, such as C, C++, Java, C# or whatever is currently flavour of the month.
But these may not be practical or politically acceptable solutions.
Compromises
So you can compromise.
XS
You may find that 95% of the time is spent in 5% of the code, doing something that perl is not that efficient at, such as bit shifting. So you could write that bit in C, leave the rest in perl, and glue it together with XS. But you'd have to learn XS and the perl API, and that's a lot of work.
Inline
Or you could use Inline. If you have to manipulate perl's internals then you'll still have to learn perl's API, but if all you need is to call out from perl to your pure C code, or someone else's C library then Inline makes it easy.
Here's my perl script making a call to a perl function rot32. And here's a C function rot32 that takes 2 integers, rotates the first by the second, and returns an integer result. That's all you need! And you run it and it works.
#!/usr/local/bin/perl -w
use strict;
printf "$_:\t%08X\t%08X\n", rot32 (0xdead, $_), rot32 (0xbeef, -$_)
foreach (0..31);
use Inline C => <<'EOC';
unsigned rot32 (unsigned val, int by) {
if (by >= 0)
return (val >> by) | (val << (32 - by));
return (val << -by) | (val >> (32 + by));
}
EOC
__END__
0: 0000DEAD 0000BEEF
1: 80006F56 00017DDE
2: 400037AB 0002FBBC
3: A0001BD5 0005F778
4: D0000DEA 000BEEF0
...
Compile your own perl?
Are you running your script on the perl supplied by the OS? Compiling your own perl could make your script go faster. For example, when perl is compiled with threading, all its internal variables are made thread safe, which slows them down a bit. If the perl is threaded, but you don't use threads then you're paying that speed hit for no reason. Likewise, you may have a better compiler than the OS used. For example, I found that with gcc 3.2 some of my C code run 5% faster than with 2.9.5. [One of my helpful hecklers in the audience said that he'd seen a 14% speedup, (if I remember correctly) and if I remember correctly that was from recompiling the perl interpreter itself]
Different perl version?
Try using a different perl version. Different releases of perl are faster at different things. If you're using an old perl, try the latest version. If you're running the latest version but not using the newer features, try an older version.
Banish the demons of stupidity
Are you using the best features of the language?
hashes
There's a Larry Wall quote - Doing linear scans over an associative array is like trying to club someone to death with a loaded Uzi.
I trust you're not doing that. But are you keeping your arrays nicely sorted so that you can do a binary search? That's fast. But using a hash should be faster.
regexps
In languages without regexps you have to write explicit code to parse strings. perl has regexps, and re-writing with them may make things 10 times faster. Even using several with the \G anchor and the /gc flags may still be faster.
if ( /\G.../gc ) {
...
} elsif ( /\G.../gc ) {
...
} elsif ( /\G.../gc ) {
pack and unpack
pack and unpack have far too many features to remember. Look at the manpage - you may be able to replace entire subroutines with just one unpack.
undef
undef. what do I mean undef?
Are you calculating something only to throw it away?
For example the script in the Encode module that compiles character conversion tables would print out a warning if it saw the same character twice. If you or I build perl we'll just let those build warnings scroll off the screen - we don't care - we can't do anything about it. And it turned out that keeping track of everything needed to generate those warnings was slowing things down considerably. So I added a flag to disable that code, and perl 5.8 defaults to use it, so it builds more quickly.
Intermission
Various helpful hecklers (most of London.pm who saw the talk (and I'm counting David Adler as part of London.pm as he's subscribed to the list)) wanted me to remind people that you really really don't want to be optimising unless you absolutely have to. You're making your code harder to maintain, harder to extend, and easier to introduce new bugs into. Probably you've done something wrong to get to the point where you need to optimise in the first place.
I agree.
Also, I'm not going to change the running order of the slides. There isn't a good order to try to describe things in, and some of the ideas that follow are actually more "good practice" than optimisation techniques, so possibly ought to come before the slides on finding slowness. I'll mark what I think are good habits to get into, and once you understand the techniques then I'd hope that you'd use them automatically when you first write code. That way (hopefully) your code will never be so slow that you actually want to do some of the brute force optimising I describe here.
Tests
Must not introduce new bugs
The most important thing when you are optimising existing working code is not to introduce new bugs.
Use your full regression tests :-)
For this, you can use your full suite of regression tests. You do have one, don't you?
[At this point the audience is supposed to laugh nervously, because I'm betting that very few people are in this desirable situation of having comprehensive tests written]
Keep a copy of original program
You must keep a copy of your original program. It is your last resort if all else fails. Check it into a version control system. Make an off site backup. Check that your backup is readable. You mustn't lose it.
In the end, your ultimate test of whether you've not introduced new bugs while optimising is to check that you get identical output from the optimised version and the original. (With the optimised version taking less time).
What causes slowness
CPU
It's obvious that if you script hogs the CPU for 10 seconds solid, then to make it go faster you'll need to reduce the CPU demand.
RAM
A lesser cause of slowness is memory.
perl trades RAM for speed
One of the design decisions Larry made for perl was to trade memory for speed, choosing algorithms that use more memory to run faster. So perl tends to use more memory.
getting slower (relative to CPU)
CPUs keep getting faster. Memory is getting faster too. But not as quickly. So in relative terms memory is getting slower. [Larry was correct to choose to use more memory when he wrote perl5 over 10 years ago. However, in the future CPU speed will continue to diverge from RAM speed, so it might be an idea to revisit some of the CPU/RAM design trade offs in parrot]
memory like a pyramid
You can never have enough memory, and it's never fast enough.
Computer memory is like a pyramid. At the point you have the CPU and its registers, which are very small and very fast to access. Then you have 1 or more levels of cache, which is larger, close by and fast to access. Then you have main memory, which is quite large, but further away so slower to access. Then at the base you have disk acting as virtual memory, which is huge, but very slow.
Now, if your program is swapping out to disk, you'll realise, because the OS can tell you that it only took 10 seconds of CPU, but 60 seconds elapsed, so you know it spent 50 seconds waiting for disk and that's your speed problem. But if your data is big enough to fit in main RAM, but doesn't all sit in the cache, then the CPU will keep having to wait for data from main RAM. And the OS timers I described count that in the CPU time, so it may not be obvious that memory use is actually your problem.
This is the original code for the part of the Encode compiler (enc2xs) that generates the warnings on duplicate characters:
if (exists $seen{$uch}) {
warn sprintf("U%04X is %02X%02X and %02X%02X\n",
$val,$page,$ch,@{$seen{$uch}});
}
else {
$seen{$uch} = [$page,$ch];
}
It uses the hash %seen to remember all the Unicode characters that it has processed. The first time that it meets a character it won't be in the hash, the exists is false, so the else block executes. It stores an arrayref containing the code page and character number in that page. That's three things per character, and there are a lot of characters in Chinese.
If it ever sees the same Unicode character again, it prints a warning message. The warning message is just a string, and this is the only place that uses the data in %seen. So I changed the code - I pre-formatted that bit of the error message, and stored a single scalar rather than the three:
if (exists $seen{$uch}) {
warn sprintf("U%04X is %02X%02X and %04X\n",
$val,$page,$ch,$seen{$uch});
}
else {
$seen{$uch} = $page << 8 | $ch;
}
That reduced the memory usage by a third, and it runs more quickly.
Step by step
How do you make things faster? Well, this is something of a black art, down to trial and error. I'll expand on aspects of these 4 points in the next slides.
What might be slow?
You need to find things that are actually slow. It's no good wasting your effort on things that are already fast - put it in where it will get maximum reward.
Think of re-write
But not all slow things can be made faster, however much you swear at them, so you can only actually speed things up if you can figure out another way of doing the same thing that may be faster.
Try it
But it may not. Check that it's faster and that it gives the same results.
Note results
Either way, note your results - I find a comment in the code is good. It's important if an idea didn't work, because it stops you or anyone else going back and trying the same thing again. And it's important if a change does work, as it stops someone else (such as yourself next month) tidying up an important optimisation and losing you that hard won speed gain.
By having commented out slower code near the faster code you can look back and get ideas for other places you might optimise in the same way.
Small easy things
These are things that I would consider good practice, so you ought to be doing them as a matter of routine.
AutoSplit and AutoLoader
If you're writing modules use the AutoSplit and AutoLoader modules to make perl only load the parts of your module that are actually being used by a particular script. You get two gains - you don't waste CPU at start up loading the parts of your module that aren't used, and you don't waste the RAM holding the the structures that perl generates when it has compiled code. So your modules load more quickly, and use less RAM.
One potential problem is that the way AutoLoader brings in subroutines makes debugging confusing, which can be a problem. While developing, you can disable AutoLoader by commenting out the __END__ statement marking the start of your AutoLoaded subroutines. That way, they are loaded, compiled and debugged in the normal fashion.
...
1;
# While debugging, disable AutoLoader like this:
# __END__
...
Of course, to do this you'll need another 1; at the end of the AutoLoaded section to keep use happy, and possibly another __END__.
Schwern notes that commenting out __END__ can cause surprises if the main body of your module is running under use strict; because now your AutoLoaded subroutines will suddenly find themselves being run under use strict. This is arguably a bug in the current AutoSplit - when it runs at install time to generate the files for AutoLoader to use it doesn't add lines such as use strict; or use warnings; to ensure that the split out subroutines are in the same environment as was current at the __END__ statement. This may be fixed in 5.10.
Elizabeth Mattijsen notes that there are different memory use versus memory shared issues when running under mod_perl, with different optimal solutions depending on whether your apache is forking or threaded.
=pod @ __END__
If you are documenting your code with one big block of pod, then you probably don't want to put it at the top of the file. The perl parser is very fast at skipping pod, but it's not magic, so it still takes a little time. Moreover, it has to read the pod from disk in order to ignore it.
#!perl -w
use strict;
=head1 You don't want to do that
big block of pod
=cut
...
1;
__END__
=head1 You want to do this
If you put your pod after an __END__ statement then the perl parser will never even see it. This will save a small amount of CPU, but if you have a lot of pod (>4K) then it might also mean that the last disk block(s) of a file are never even read in to RAM. This may gain you some speed. [A helpful heckler observed that modern raid systems may well be reading in 64K chunks, and modern OSes are getting good at read ahead, so not reading a block as a result of =pod @ __END__ may actually be quite rare.]
If you are putting your pod (and tests) next to their functions' code (which is probably a better approach anyway) then this advice is not relevant to you.
Needless importing is slow
Exporter is written in perl. It's fast, but not instant.
Most modules are able to export lots of their functions and other symbols into your namespace to save you typing. If you have only one argument to use, such as
use POSIX; # Exports all the defaults
then POSIX will helpfully export its default list of symbols into your namespace. If you have a list after the module name, then that is taken as a list of symbols to export. If the list is empty, no symbols are exported:
use POSIX (); # Exports nothing.
You can still use all the functions and other symbols - you just have to use their full name, by typing POSIX:: at the front. Some people argue that this actually makes your code clearer, as it is now obvious where each subroutine is defined. Independent of that, it's faster:
use POSIX; use POSIX ();
0.516s 0.355s
use Socket; use Socket ();
0.270s 0.231s
POSIX exports a lot of symbols by default. If you tell it to export none, it starts in 30% less time. Socket starts in 15% less time.
regexps
avoid $&
The $& variable returns the last text successfully matched in any regular expression. It's not lexically scoped, so unlike the match variables $1 etc it isn't reset when you leave a block. This means that to be correct perl has to keep track of it from any match, as perl has no idea when it might be needed. As it involves taking a copy of the matched string, it's expensive for perl to keep track of. If you never mention $&, then perl knows it can cheat and never store it. But if you (or any module) mentions $& anywhere then perl has to keep track of it throughout the script, which slows things down. So it's a good idea to capture the whole match explicitly if that's what you need.
$text =~ /.* rules/;
$line = $&; # Now every match will copy $& - slow
$text =~ /(.* rules)/;
$line = $1; # Didn't mention $& - fast
avoid use English;
use English gives helpful long names to all the punctuation variables. Unfortunately that includes aliasing $& to $MATCH which makes perl think that it needs to copy every match into $&, even if you script never actually uses it. In perl 5.8 you can say use English '-no_match_vars'; to avoid mentioning the naughty "word", but this isn't available in earlier versions of perl.
avoid needless captures
Are you using parentheses for capturing, or just for grouping? Capturing involves perl copying the matched string into $1 etc, so it all you need is grouping use a the non-capturing (?:...) instead of the capturing (...).
/.../o;
If you define scalars with building blocks for your regexps, and then make your final regexp by interpolating them, then your final regexp isn't going to change. However, perl doesn't realise this, because it sees that there are interpolated scalars each time it meets your regexp, and has no idea that their contents are the same as before. If your regexp doesn't change, then use the /o flag to tell perl, and it will never waste time checking or recompiling it.
but don't blow it
You can use the qr// operator to pre-compile your regexps. It often is the easiest way to write regexp components to build up more complex regexps. Using it to build your regexps once is a good idea. But don't screw up (like parrot's assemble.pl did) by telling perl to recompile the same regexp every time you enter a subroutine:
sub foo {
my $reg1 = qr/.../;
my $reg2 = qr/... $reg1 .../;
You should pull those two regexp definitions out of the subroutine into package variables, or file scoped lexicals.
Devel::DProf
You find what is slow by using a profiler. People often guess where they think their program is slow, and get it hopelessly wrong. Use a profiler.
Devel::DProf is in the perl core from version 5.6. If you're using an earlier perl you can get it from CPAN.
You run your program with -d:DProf
perl5.8.0 -d:DProf enc2xs.orig -Q -O -o /dev/null ...
which times things and stores the data in a file named tmon.out. Then you run dprofpp to process the tmon.out file, and produce meaningful summary information. This excerpt is the default length and format, but you can use options to change things - see the man page. It also seems to show up a minor bug in dprofpp, because it manages to total things up to get 106%. While that's not right, it doesn't affect the explanation.
Total Elapsed Time = 66.85123 Seconds
User+System Time = 62.35543 Seconds
Exclusive Times
%Time ExclSec CumulS #Calls sec/call Csec/c Name
106. 66.70 102.59 218881 0.0003 0.0005 main::enter
49.5 30.86 91.767 6 5.1443 15.294 main::compile_ucm
19.2 12.01 8.333 45242 0.0003 0.0002 main::encode_U
4.74 2.953 1.078 45242 0.0001 0.0000 utf8::unicode_to_native
4.16 2.595 0.718 45242 0.0001 0.0000 utf8::encode
0.09 0.055 0.054 5 0.0109 0.0108 main::BEGIN
0.01 0.008 0.008 1 0.0078 0.0078 Getopt::Std::getopts
0.00 0.000 -0.000 1 0.0000 - Exporter::import
0.00 0.000 -0.000 3 0.0000 - strict::bits
0.00 0.000 -0.000 1 0.0000 - strict::import
0.00 0.000 -0.000 2 0.0000 - strict::unimport
At the top of the list, the subroutine enter takes about half the total CPU time, with 200,000 calls, each very fast. That makes it a good candidate to optimise, because all you have to do is make a slight change that gives a small speedup, and that gain will be magnified 200,000 times. [It turned out that enter was tail recursive, and part of the speed gain I got was by making it loop instead]
Third on the list is encode_U, which with 45,000 calls is similar, and worth looking at. [Actually, it was trivial code and in the real enc2xs I inlined it]
utf8::unicode_to_native and utf8::encode are built-ins, so you won't be able to change that.
Don't bother below there, as you've accounted for 90% of total program time, so even if you did a perfect job on everything else, you could only make the program run 10% faster.
compile_ucm is trickier - it's only called 6 times, so it's not obvious where to look for what's slow. Maybe there's a loop with many iterations. But now you're guessing, which isn't good.
One trick is to break it into several subroutines, just for benchmarking, so that DProf gives you times for different bits. That way you can see where the juicy bits to optimise are.
Devel::SmallProf should do line by line profiling, but every time I use it it seems to crash.
Benchmark
Now you've identified the slow spots, you need to try alternative code to see if you can find something faster. The Benchmark module makes this easy. A particularly good subroutine is cmpthese, which takes code snippets and plots a chart. cmpthese was added to Benchmark with perl 5.6.
So to compare two code snippets orig and new by running each for 10000 times you'd do this:
use Benchmark ':all';
sub orig {
...
}
sub new {
...
}
cmpthese (10000, { orig => \&orig, new => \&new } );
Benchmark runs both, times them, and then prints out a helpful comparison chart:
Benchmark: timing 10000 iterations of new, orig...
new: 1 wallclock secs ( 0.70 usr + 0.00 sys = 0.70 CPU) @ 14222.22/s (n=10000)
orig: 4 wallclock secs ( 3.94 usr + 0.00 sys = 3.94 CPU) @ 2539.68/s (n=10000)
Rate orig new
orig 2540/s -- -82%
new 14222/s 460% --
and it's plain to see that my new code is over 4 times as fast as my original code.
What causes slowness in perl?
Actually, I didn't tell the whole truth earlier about what causes slowness in perl. [And astute hecklers such as Philip Newton had already told me this]
When perl compilers your program it breaks it down into a sequence of operations it must perform, which are usually referred to as ops. So when you ask perl to compute $a = $b + $c it actually breaks it down into these ops:
* Fetch $b onto the stack
* Fetch $c onto the stack
* Add the top two things on the stack together; write the result to the stack
* Fetch the address of $a
* Place the thing on the top of stack into that address
Computers are fast at simple things like addition. But there is quite a lot of overhead involved in keeping track of "which op am I currently performing" and "where is the next op", and this book-keeping often swamps the time taken to actually run the ops. So often in perl it's the number of ops your program takes to perform its task that is more important than the CPU they use or the RAM it needs. The hit list is
1. Ops
2. CPU
3. RAM
So what were my example code snippets that I Benchmarked?
It was code to split a line of hex (54726164696e67207374796c652f6d61) into groups of 4 digits (5472 6164 696e ...) , and convert each to a number
sub orig {
map {hex $_} $line =~ /(....)/g;
}
sub new {
unpack "n*", pack "H*", $line;
}
The two produce the same results:
orig new
21618, 24932, 26990, 26400, 29556, 31084, 25903, 28001, 26990, 29793, 26990, 24930, 26988, 26996, 31008, 26223, 29216, 29552, 25957, 25646 21618, 24932, 26990, 26400, 29556, 31084, 25903, 28001, 26990, 29793, 26990, 24930, 26988, 26996, 31008, 26223, 29216, 29552, 25957, 25646
but the first one is much slower. Why? Following the data path from right to left, it starts well with a global regexp, which is only one op and therefore a fast way to generate a list of the 4 digit groups. But that map block is actually an implicit loop, so for each 4 digit block it iterates round and repeatedly calls hex. Thats at least one op for every list item.
Whereas the second one has no loops in it, implicit or explicit. It uses one pack to convert the hex temporarily into a binary string, and then one unpack to convert that string into a list of numbers. n is big endian 16 bit quantities. I didn't know that - I had to look it up. But when the profiler told me that this part of the original code was a performance bottleneck, the first think that I did was to look at the the pack docs to see if I could use some sort of pack/unpack as a speedier replacement.
Ops are bad, m'kay
You can ask perl to tell you the ops that it generates for particular code with the Terse backend to the compiler. For example, here's a 1 liner to show the ops in the original code:
$ perl -MO=Terse -e'map {hex $_} $line =~ /(....)/g;'
LISTOP (0x16d9c8) leave [1]
OP (0x16d9f0) enter
COP (0x16d988) nextstate
LOGOP (0x16d940) mapwhile [2]
LISTOP (0x16d8f8) mapstart
OP (0x16d920) pushmark
UNOP (0x16d968) null
UNOP (0x16d7e0) null
LISTOP (0x115370) scope
OP (0x16bb40) null [174]
UNOP (0x16d6e0) hex [1]
UNOP (0x16d6c0) null [15]
SVOP (0x10e6b8) gvsv GV (0xf4224) *_
PMOP (0x114b28) match /(....)/
UNOP (0x16d7b0) null [15]
SVOP (0x16d700) gvsv GV (0x111f10) *line
At the bottom you can see how the match /(....)/ is just one op. But the next diagonal line of ops from mapwhile down to the match are all the ops that make up the map. Lots of them. And they get run each time round map's loop. [Note also that the {}s mean that map enters scope each time round the loop. That not a trivially cheap op either]
Whereas my replacement code looks like this:
$ perl -MO=Terse -e'unpack "n*", pack "H*", $line;'
LISTOP (0x16d818) leave [1]
OP (0x16d840) enter
COP (0x16bb40) nextstate
LISTOP (0x16d7d0) unpack
OP (0x16d7f8) null [3]
SVOP (0x10e6b8) const PV (0x111f94) "n*"
LISTOP (0x115370) pack [1]
OP (0x16d7b0) pushmark
SVOP (0x16d6c0) const PV (0x111f10) "H*"
UNOP (0x16d790) null [15]
SVOP (0x16d6e0) gvsv GV (0x111f34) *line
There are less ops in total. And no loops, so all the ops you see execute only once. :-)
[My helpful hecklers pointed out that it's hard to work out what an op is. Good call. There's roughly one op per symbol (function, operator, variable name, and any other bit of perl syntax). So if you golf down the number of functions and operators your program runs, then you'll be reducing the number of ops.]
[These were supposed to be the bonus slides. I talked to fast (quelle surprise) and so manage to actually get through the lot with time for questions]
Memoize
Caches function results
MJD's Memoize follows the grand perl tradition by trading memory for speed. You tell Memoize the name(s) of functions you'd like to speed up, and it does symbol table games to transparently intercept calls to them. It looks at the parameters the function was called with, and uses them to decide what to do next. If it hasn't seen a particular set of parameters before, it calls the original function with the parameters. However, before returning the result, it stores it in a hash for that function, keyed by the function's parameters. If it has seen the parameters before, then it just returns the result direct from the hash, without even bothering to call the function.
For functions that only calculate
This is useful for functions that calculate things with no side effects, slow functions that you often call repeatedly with the same parameters. It's not useful for functions that do things external to the program (such as generating output), nor is it good for very small, fast functions.
Can tie cache to a disk file
The hash Memoize uses is a regular perl hash. This means that you can tie the hash to a disk file. This allows Memoize to remember things across runs of your program. That way, you could use Memoize in a CGI to cache static content that you only generate on demand (but remember you'll need file locking). The first person who requests something has to wait for the generation routine, but everyone else gets it straight from the cache. You can also arrange for another program to periodically expire results from the cache.
As of 5.8 Memoize module has been assimilated into the core. Users of earlier perl can get it from CPAN.
Miscellaneous
These are quite general ideas for optimisation that aren't particularly perl specific.
Pull things out of loops
perl's hash lookups are fast. But they aren't as fast as a lexical variable. enc2xs was calling a function each time round a loop based on a hash lookup using $type as the key. The value of $type didn't change, so I pulled the lookup out above the loop into a lexical variable:
my $type_func = $encode_types{$type};
and doing it only once was faster.
Experiment with number of arguments
Something else I found was that enc2xs was calling a function which took several arguments from a small number of places. The function contained code to set defaults if some of the arguments were not supplied. I found that the way the program ran, most of the calls passed in all the values and didn't need the defaults. Changing the function to not set defaults, and writing those defaults out explicitly where needed bought me a speed up.
Tail recursion
Tail recursion is where the last thing a function does it call itself again with slightly different arguments. It's a common idiom, and some languages can automatically optimise it away. Perl is not one of those languages. So every time a function tail recurses you have another subroutine call [not cheap - Arthur Bergman notes that it is 10 pages of C source, and will blow the instruction cache on a CPU] and re-entering that subroutine again causes more memory to be allocated to store a new set of lexical variables [also not cheap].
perl can't spot that it could just throw away the old lexicals and re-use their space, but you can, so you can save CPU and RAM by re-writing your tail recursive subroutines with loops. In general, trying to reduce recursion by replacing it with iterative algorithms should speed things up.
yay for y
y, or tr, is the transliteration operator. It's not as powerful as the general purpose regular expression engine, but for the things it can do it is often faster.
tr/!// # fastest way to count chars
tr doesn't delete characters unless you use the /d flag. If you don't even have any replacement characters then it treats its target as read only. In scalar context it returns the number of characters that matched. It's the fastest way to count the number of occurrences of single characters and character ranges. (ie it's faster than counting the elements returned by m/.../g in list context. But if you just want to see whether one or more of a character is present use m/.../, because it will stop at the u first, whereas tr/// has to go to the end)
tr/q/Q/ faster than s/q/Q/g
tr is also faster than the regexp engine for doing character-for-character substitutions.
tr/a-z//d faster than s/[a-z]//g
tr is faster than the regexp engines for doing character range deletions. [When writing the slide I assumed that it would be faster for single character deletions, but I Benchmarked things and found that s///g was faster for them. So never guess timings; always test things. You'll be surprised, but that's better than being wrong]
Ops are bad, m'kay
Another example lifted straight from enc2xs of something that I managed to accelerate quite a bit by reducing the number of ops run. The code takes a scalar, and prints out each byte as \x followed by 2 digits of hex, as it's generating C source code:
#foreach my $c (split(//,$out_bytes)) {
# $s .= sprintf "\\x%02X",ord($c);
#}
# 9.5% faster changing that loop to this:
$s .= sprintf +("\\x%02X" x length $out_bytes), unpack "C*", $out_bytes;
The original makes a temporary list with split [not bad in itself - ops are more important than CPU or RAM] and then loops over it. Each time round the loop it executes several ops, including using ord to convert the byte to its numeric value, and then using sprintf with the format "\\x%02X" to convert that number to the C source.
The new code effectively merges the split and looped ord into one op, using unpack's C format to generate the list of numeric values directly. The more interesting (arguably sick) part is the format to sprintf, which is inside +(...). You can see from the .= in the original that the code is just concatenating the converted form of each byte together. So instead of making sprintf convert each value in turn, only for perl ops to stick them together, I use x to replicate the per-byte format string once for each byte I'm about to convert. There's now one "\\x%02X" for each of the numbers in the list passed from unpack to sprintf, so sprintf just does what it's told. And sprintf is faster than perl ops.
How to make perl fast enough
use the language's fast features
You have enormous power at your disposal with regexps, pack, unpack and sprintf. So why not use them?
All the pack and unpack code is implemented in pure C, so doesn't have any of the book-keeping overhead of perl ops. sprintf too is pure C, so it's fast. The regexp engine uses its own private bytecode, but it's specially tuned for regexps, so it runs much faster than general perl code. And the implementation of tr has less to do than the regexp engine, so it's faster.
For maximum power, remember that you can generate regexps and the formats for pack, unpack and sprintf at run time, based on your data.
give the interpreter hints
Make it obvious to the interpreter what you're up to. Avoid $&, use (?:...) when you don't need capturing, and put the /o flag on constant regexps.
less OPs
Try to accomplish your tasks using less operations. If you find you have to optimise an existing program then this is where to start - golf is good, but remember it's run time strokes not source code strokes.
less CPU
Usually you want to find ways of using less CPU.
less RAM
but don't forget to think about how your data structures work to see if you can make them use less RAM.
© 2002 Nicholas Clark
7/13/2010
Perl optimization article
12/10/2009
Solution to deal with trouble with your boss
If you have trouble with your boss consider this article:
http://www.lifehack.org/articles/management/what-to-do-if-you-dont-get-along-with-your-boss.html
What to Do if You Don’t Get Along with Your Boss

What should you do if you really cannot get on with your boss at work? Maybe there has been a breakdown in trust, in communication or in respect. In any event it is ruining your time at work and making you frustrated and unhappy. Let’s call your manager “John” and see how we can approach the situation. (The advice here works equally well whether your boss is a man or a woman).
1. How do other people find him? Does everyone have a hard time with John or is it just you? Check out how other people get on with him by asking subtle questions – do not rant about how awful he is and see if others agree. If everyone has a problem with him then you have some common ground on which to work. If only you have difficulties with him then you need to examine yourself and your relationship with him.
2. Ask yourself why. List all the reasons why you think things are not working between you. There are probably some big assumptions on your list so you will need to validate them carefully.
3. Have a heart to heart meeting. Schedule a time to meet John when he is not under pressure. Tell him that you want to discuss some important issues. At the meeting explain very calmly and rationally that you do not feel the relationship is working well and that you would like to explore why and how to improve it. Do not go into a long list of complaints and sores. Take a factual example if you can and start from there. Let him do most of the talking. Try to see the situation from his point of view and understand exactly what he sees as the issues. See how many of the problems you listed at point 2 above are real.
4. Agree an action plan. If you can agree a plan for outcomes that you both want then it really helps. What is it that he wants you to achieve? If you deliver it will he be happy with your performance? Even if you disagree on all sorts of other things try to agree on what your key job objectives are. Ideally you should agree actions that each of you will take to improve the working relationship.
5. Try to understand his objectives and motivation. Even if John is lazy, dishonest and spiteful you can still find out what he is keen to achieve and work with him towards his goals. If you can find a way to help him with his objectives then maybe you can work around his faults. A good rule at work is to help your boss to succeed – whether you like him or not. Other people will see you do this and it works to your credit – especially if they know that your boss is difficult.
6. Go over his head. This is a risky option but sometimes it is necessary – especially if most other people share the same problems with John. Have a quiet word with your boss’s boss and say that you feel that the department is not achieving all that it could. Make some broad suggestions about how things could be improved without making direct accusations against John. Let the senior manager read between the lines; he or she probably knows already.
7. Move sideways in the organization. If you cannot move up then move across for a while. Get some experience in another department. Eventually John will move on, be fired or quit. If you are seen as a positive contributor then you may get your chance to do John’s job better than he did.
8. Quit. Life is too short to spend it in a job that makes you miserable. If you have tried all of the routes above and are still blocked and frustrated then find a job elsewhere. There are plenty of good bosses who want enthusiastic and diligent people to work for them.
Sooner or later most of us will get a difficult boss to deal with. Do not become sullen or aggressive. The trick is to figure out a way to get on with the boss in a manner that helps both of you. It can nearly always be done.
9/08/2009
Perl profiler
I thought I put this here before but I guess it was only in my imagination...
Here is a routine to use Dprof to profile your perl code for debug and optimize your code.
Src: http://docstore.mik.ua/orelly/perl/prog3/ch20_06.htm
20.6. The Perl Profiler
Do you want to make your program faster? Well, of course you do. But first you should stop and ask yourself, "Do I really need to spend time making this program faster?" Recreational optimization can be fun,[2] but normally there are better uses for your time. Sometimes you just need to plan ahead and start the program when you're going on a coffee break. (Or use it as an excuse for one.) But if your program absolutely must run faster, you should begin by profiling it. A profiler can tell you which parts of your program take the most time to execute, so you won't waste time optimizing a subroutine that has an insignificant effect on the overall execution time.
[2] Or so says Nathan Torkington, who contributed this section of the book.
Perl comes with a profiler, the Devel::DProf module. You can use it to profile the Perl program in mycode.pl by typing:
Even though we've called it a profiler--since that's what it does--the mechanism DProf employs is the very same one we discussed earlier in this chapter. DProf is just a debugger that records the time Perl entered and left each subroutine.perl -d:DProf mycode.pl
When your profiled script terminates, DProf will dump the timing information to a file called tmon.out. The dprofpp program that came with Perl knows how to analyze tmon.out and produce a report. You may also use dprofpp as a frontend for the whole process with the -p switch (see described later).
Given this program:
the output of dprofpp is:outer();
sub outer {
for (my $i=0; $i < 100; $i++) { inner() }
}
sub inner {
my $total = 0;
for (my $i=0; $i < 1000; $i++) { $total += $i }
}
inner();
Note that the percentage numbers don't add up to 100. In fact, in this case, they're pretty far off, which should tip you off that you need to run the program longer. As a general rule, the more profiling data you can collect, the better your statistical sample. If we increase the outer loop to run 1000 times instead of 100 times, we'll get more accurate results:Total Elapsed Time = 0.537654 Seconds
User+System Time = 0.317552 Seconds
Exclusive Times
%Time ExclSec CumulS #Calls sec/call Csec/c Name
85.0 0.270 0.269 101 0.0027 0.0027 main::inner
2.83 0.009 0.279 1 0.0094 0.2788 main::outer
The first line reports how long the program took to run, from start to finish. The second line displays the total of two different numbers: the time spent executing your code ("user") and the time spent in the operating system executing system calls made by your code ("system"). (We'll have to forgive a bit of false precision in these numbers--the computer's clock almost certainly does not tick every millionth of a second. It might tick every hundredth of a second if you're lucky.)Total Elapsed Time = 2.875946 Seconds
User+System Time = 2.855946 Seconds
Exclusive Times
%Time ExclSec CumulS #Calls sec/call Csec/c Name
99.3 2.838 2.834 1001 0.0028 0.0028 main::inner
0.14 0.004 2.828 1 0.0040 2.8280 main::outer
The "user+system" times can be changed with command-line options to dprofpp. -r displays elapsed time, -s displays system time only, and -u displays user time only.
The rest of the report is a breakdown of the time spent in each subroutine. The "Exclusive Times" line indicates that when subroutine outer called subroutine inner, the time spent in inner didn't count towards outer's time. To change this, causing inner's time to be counted towards outer's, give the -I option to dprofpp.
For each subroutine, the following is reported: %Time, the percentage of time spent in this subroutine call; ExclSec, the time in seconds spent in this subroutine not including those subroutines called from it; CumulS, the time in seconds spent in this subroutine and those called from it; #Calls, the number of calls to the subroutine; sec/call, the average time in seconds of each call to the subroutine not including those called from it; Csec/c, the average time in seconds of each call to the subroutine and those called from it.
Of those, the most useful figure is %Time, which will tell you where your time goes. In our case, the inner subroutine takes the most time, so we should try to optimize that subroutine, or find an algorithm that will call it less. :-)
Options to dprofpp provide access to other information or vary the way the times are calculated. You can also make dprofpp run the script for you in the first place, so you don't have to remember the -d:DProf switch:
- -p SCRIPT
-
Tells dprofpp that it should profile the given SCRIPT and then interpret its profile data. See also -Q.
- -Q
-
Used with -p to tell dprofpp to quit after profiling the script, without interpreting the data.
- -a
-
Sort output alphabetically by subroutine name rather than by decreasing percentage of time.
- -R
-
Count anonymous subroutines defined in the same package separately. The default behavior is to count all anonymous subroutines as one, named main::__ANON__.
- -I
-
Display all subroutine times inclusive of child subroutine times.
- -l
-
Sort by number of calls to the subroutines. This may help identify candidates for inlining.
- -O COUNT
-
Show only the top COUNT subroutines. The default is 15.
- -q
-
Do not display column headers.
- -T
-
Display the subroutine call tree to standard output. Subroutine statistics are not displayed.
- -t
-
Display the subroutine call tree to standard output. Subroutine statistics are not displayed. A function called multiple (consecutive) times at the same calling level is displayed once, with a repeat count.
- -S
-
Produce output structured by the way your subroutines call one another:
Read this as follows: the top level of your program called inner once, and it ran for 0.008s elapsed time, and the top level called outer once and it ran for 0.467s inclusively (0s in outer itself, 0.468s in the subroutines called from outer) calling inner 100 times (which ran for 0.468s). Whew, got that?main::inner x 1 0.008s
main::outer x 1 0.467s = (0.000 + 0.468)s
main::inner x 100 0.468sBranches at the same level (for example, inner called once and outer called once) are sorted by inclusive time.
- -U
-
Do not sort. Display in the order found in the raw profile.
- -v
-
Sort by average time spent in subroutines during each call. This may help identify candidates for hand optimization by inlining subroutine bodies.
- -g subroutine
-
Ignore subroutines except subroutine and whatever is called from it.
Other options are described in dprofpp(1), its standard manpage.
DProf is not your only choice for profiler. CPAN also holds Devel::SmallProf, which reports the time spent in each line of your program. That can help you figure out if you're using some particular Perl construct that is being surprisingly expensive. Most of the built-in functions are pretty efficient, but it's easy to accidentally write a regular expression whose overhead increases exponentially with the size of the input. See also the section Section 20.2, "Efficiency" in Chapter 24, "Common Practices", for other helpful hints.
8/27/2009
Perl display the progress indicator
In most cases in perl progress indicator, most people uses print statement without carry over or '\n' to show where you are. The problem with this s that unless that buffer is set to unbuffer, it will waitin until carry over before it is displayed on the terminal. So, unless it's done, you are not going to see the progress...
Simple solution to this is to set unbuffer as setting $| to 1. All done, simple.
$| = 1;
Now it will display as it progresses.
5/27/2009
How to download a file from the Web using Perl
Simple enough, use LWP!
NAMEget, head, getprint, getstore, mirror - Procedural LWP interface SYNOPSIS
DESCRIPTIONThis interface is intended for those who want a simplified view of the libwww-perl library. It should also be suitable for one-liners. If you need more control or access to the header fields in the requests sent and responses received you should use the full object oriented interface provided by the The following functions are provided (and exported) by this module:
This module also exports the HTTP::Status constants and procedures. These can be used when you check the response code from getprint(), getstore() and mirror(). The constants are:
The HTTP::Status classification functions are:
The module will also export the LWP::UserAgent object as The user agent created by this module will identify itself as "LWP::Simple/#.##" (where "#.##" is the libwww-perl version number) and will initialize its proxy defaults from the environment (by calling $ua->env_proxy). | ||||
3/30/2009
Complete perl reserved variable list
Amazingly complete perl's reserved variable list!
Source: http://www.sarand.com/td/ref_perl_reserve.html
Quote:
Reserved Literals
__END__ indicates the logical end of the script (^D and ^Z are synonyms)
__FILE__ current filename
__LINE__ current line number
Reserved Filehandles
<> Null filehanedle - input from either stdin, or files specified on the command line. Psuedonym for internal filehandle
DATA read data only from the main script, but not from any required file or evaluated string.
STDERR Output to stderr
STDIN Input from stdin
STDOUT Output to stdout
Reserved Variables
$_ The default input and pattern-searching space. The following pairs are equivalent:
while (<>) {...} while ($_ = <>) {...} # only equivalent in while!
/^Subject:/ $_ =~ /^Subject:/
tr/a-z/A-Z/ $_ =~ tr/a-z/A-Z/
chop chop($_)
Also: $ARG
@_ The parameters passed to a subroutine. The array itself is local to the subroutine, but its values are references to the variables that are passed so updates to the members of the array will update the corresponding parameter value.
$& The string matched by the last successful pattern match (not counting any matches hidden within a BLOCK or eval() enclosed by the current BLOCK). This variable is read-only.
Also: $MATCH
$` The string preceding whatever was matched by the last successful pattern match, not counting any matches hidden within a BLOCK or eval enclosed by the current BLOCK. This variable is read-only.
Also: $PREMATCH
$' The string following whatever was matched by the last successful pattern match (not counting any matches hidden within a BLOCK or eval() enclosed by the current BLOCK). Example:
$_ = 'abcdefghi';
/def/;
print "$`:$&:$'\n"; # prints abc:def:ghi
This variable is read-only.
Also: $POSTMATCH
$+ The last bracket matched by the last search pattern. This is useful if you don't know which of a set of alternative patterns matched. For example:
/Version: (.*)|Revision: (.*)/ && ($rev = $+);
This variable is read-only.
Also: $LAST_PAREN_MATCH
$* Set to 1 to do multiline matching within a string, 0 to tell Perl that it can assume that strings contain a single line, for the purpose of optimizing pattern matches. Pattern matches on strings containing multiple newlines can produce confusing results when " $* " is 0. Default is 0. Note that this variable only influences the interpretation of " ^ " and " $ ". A literal newline can be searched for even when $* == 0 . The '/m' modifier should be used instead when pattern matching.
Also: $MULTILINE_MATCHING
$. The current input line number of the last filehandle that was read. This variable should be considered read-only. Remember that only an explicit close on the filehandle resets the line number. Since " <> " never does an explicit close, line numbers increase across ARGV files.
Also: $NR, $INPUT_LINE_NUMBER, input_line_number HANDLE EXPR
$/ The input record separator, newline by default. Works like awk 's RS variable, including treating blank lines as delimiters if set to the null string. You may set it to a multicharacter string to match a multi-character delimiter. Note that setting it to "\n\n" means something slightly different than setting it to "" , if the file contains consecutive blank lines. Setting it to "" will treat two or more consecutive blank lines as a single blank line. Setting it to "\n\n" will blindly assume that the next input character belongs to the next paragraph, even if it's a newline.
undef $/;
$_ =
s/\n[ \t]+/ /g;
Also: $RS, $INPUT_RECORD_SEPARATOR, input_record_separator HANDLE EXPR
$| If set to nonzero, forces a flush after every write or print on the currently selected output channel. Default is 0. Note that STDOUT will typically be line buffered if output is to the terminal and block buffered otherwise. Setting this variable is useful primarily when you are outputting to a pipe, such as when you are running a Perl script under rsh and want to see the output as it's happening.
Also: $OUTPUT_AUTOFLUSH, autoflush HANDLE EXPR
$, The output field separator for the print operator. Ordinarily the print operator simply prints out the comma separated fields you specify. In order to get behavior more like awk, set this variable as you would set awk 's OFS variable to specify what is printed between fields.
Also: $OFS, $OUTPUT_FIELD_SEPARATOR, output_field_separator HANDLE EXPR
$\ The output record separator for the print operator. Ordinarily the print operator simply prints out the comma separated fields you specify, with no trailing newline or record separator assumed.
Also: $ORS, $OUTPUT_RECORD_SEPARATOR, output_record_separator HANDLE EXPR
$" Delimiter used when interpreting an array as a scalar. This value separates each element of the array in the resulting string - default a space.
Also: $LIST_SEPARATOR
$; The subscript separator for multi-dimensional array emulation, which can be declared directly in v.5. If you refer to a hash element as
$foo{$a,$b,$c}
it really means
$foo{join($;, $a, $b, $c)}
But don't put
@foo{$a,$b,$c} # a slice--note the @
which means
($foo{$a},$foo{$b},$foo{$c})
Default is "\034", the same as SUBSEP in awk . Note that if your keys contain binary data there might not be any safe value for " $; ".
Also: $SUBSEP, $SUBSCRIPT_SEPARATOR
$# The output format for printed numbers. The initial value is '%. 20g'. Deprecated in Perl 5.
Also: $OFMT
$% The current page number of the currently selected output channel.
Also: $FORMAT_PAGE_NUMBER, format_page_number HANDLE EXPR
$= The current page length (printable lines) of the currently selected output channel. Default is 60.
Also: $FORMAT_LINES_PER_PAGE, format_lines_per_page HANDLE EXPR
$- The number of lines left on the page of the currently selected output channel.
Also: $FORMAT_LINES_LEFT, format_lines_left HANDLE EXPR
$~ The name of the current report format for the currently selected output channel. Default is name of the filehandle.
Also: $FORMAT_NAME, format_name HANDLE EXPR
$^ The name of the current top-of-page format for the currently selected output channel. Default is name of the filehandle with _TOP appended.
Also: $FORMAT_TOP_NAME, format_top_name HANDLE EXPR
$: The current set of characters after which a string may be broken to fill continuation fields (starting with ^) in a format. Default is S<" \n-">, to break on whitespace or hyphens.
Also: $FORMAT_LINE_BREAK_CHARACTERS, format_line_break_characters HANDLE EXPR
$^ L What formats output to perform a formfeed. Default is \f.
Also: $FORMAT_FORMFEED, format_formfeed HANDLE EXPR
$^ A The current value of the write() accumulator for format() lines. A format contains formline() commands that put their result into $^ A . After calling its format, write() prints out the contents of $^ A and empties. So you never actually see the contents of $^ A unless you call formline() yourself and then look at it.
Also: $ACCUMULATOR
$? The status returned by the last pipe close, backtick ( `` ) command, or system() operator. Note that this is the status word returned by the wait() system call, so the exit value of the subprocess is actually ( $? >> 8 ). Thus on many systems, $? & 255 gives which signal, if any, the process died from, and whether there was a core dump.
Also: $CHILD_ERROR
$! If used in a numeric context, yields the current value of errno, with all the usual caveats. (This means that you shouldn't depend on the value of " $! " to be anything in particular unless you've gotten a specific error return indicating a system error.) If used in a string context, yields the corresponding system error string. You can assign to " $! " in order to set errno if, for instance, you want " $! " to return the string for error n , or you want to set the exit value for the die() operator.
Also: $ERRNO, $OS_ERROR
$@ The Perl syntax error message from the last eval() command. If null, the last eval() parsed and executed correctly (although the operations you invoked may have failed in the normal fashion).
Also: $EVAL_ERROR
$$ The process number of the Perl running this script.
Also: $PID, $PROCESS_ID
$< The real uid of this process.
Also: $UID, $REAL_USER_ID
$> The effective uid of this process. Example:
$< = $>; # set real to effective uid
($<,$>) = ($>,$<); # swap real and effective uid
Also: $EUID, $EFFECTIVE_USER_ID
$( The real gid of this process. If you are on a machine that supports membership in multiple groups simultaneously, gives a space separated list of groups you are in. The first number is the one returned by getgid() , and the subsequent ones by getgroups() , one of which may be the same as the first number.
Also: $GID, $REAL_GROUP_ID
$) The effective gid of this process. If you are on a machine that supports membership in multiple groups simultaneously, gives a space separated list of groups you are in. The first number is the one returned by getegid() , and the subsequent ones by getgroups() , one of which may be the same as the first number.
Note: " $& lt; ", " $& gt; ", " $( " and " $) " can only be set on machines that support the corresponding set[re][ug] id() routine. " $( " and " $) " can only be swapped on machines supporting setregid() .
Also: $EGID, $EFFECTIVE_GROUP_ID
$0 Contains the name of the file containing the Perl script being executed. Assigning to " $0 " modifies the argument area that the ps(1) program sees. This is more useful as a way of indicating the current program state than it is for hiding the program you're running.
Also: $PROGRAM_NAME
$[ The index of the first element in an array, and of the first character in a substring. Default is 0, but you could set it to 1 to make Perl behave more like awk (or Fortran) when subscripting and when evaluating the index() and substr() functions.
As of Perl 5, assignment to " $[ " is treated as a compiler directive, and cannot influence the behavior of any other file. Its use is discouraged.
$] The string printed out when you say perl -v . It can be used to determine at the beginning of a script whether the perl interpreter executing the script is in the right range of versions. If used in a numeric context, returns the version + patchlevel / 1000. Example:
# see if getc is available
($version,$patchlevel) =
$] =~ /(\d+\.\d+).*\nPatch level: (\d+)/;
print STDERR "(No filename completion available.)\n"
if $version * 1000 + $patchlevel < 2016;
or, used numerically,
warn "No checksumming!\n" if $] < 3.019;
Also: $PERL_VERSION
$^ D The current value of the debugging flags.
Also: $DEBUGGING
$^ F The maximum system file descriptor, ordinarily 2. System file descriptors are passed to exec() ed processes, while higher file descriptors are not. Also, during an open() , system file descriptors are preserved even if the open() fails. (Ordinary file descriptors are closed before the open() is attempted.) Note that the close-on-exec status of a file descriptor will be decided according to the value of $^ F at the time of the open, not the time of the exec.
Also: $SYSTEM_FD_MAX
$^ I The current value of the inplace-edit extension. Use undef to disable inplace editing.
Also: $INPLACE_EDIT
$^ P The internal flag that the debugger clears so that it doesn't debug itself. You could conceivable disable debugging yourself by clearing it.
Also: $PERLDB
$^ T The time at which the script began running, in seconds since the epoch (beginning of 1970). The values returned by the -M , -A and -C filetests are based on this value.
Also: $BASETIME
$^ W The current value of the warning switch, either TRUE or FALSE.
Also: $WARNING
$^ X The name that the Perl binary itself was executed as, from C's argv[0] .
Also: $EXECUTABLE_NAME
$ARGV The name of the current file when reading from <>.
@ARGV The array @ARGV contains the command line arguments intended for the script. Note that $# ARGV is the generally number of arguments minus one, since $ARGV [0] is the first argument, NOT the command name. See " $0 " for the command name.
@INC The array @INC contains the list of places to look for Perl scripts to be evaluated by the do EXPR , require , or use constructs. It initially consists of the arguments to any -I command line switches, followed by the default Perl library, probably "/usr/local/lib/perl", followed by ".", to represent the current directory.
%INC The hash %INC contains entries for each filename that has been included via do or require . The key is the filename you specified, and the value is the location of the file actually found. The require command uses this array to determine whether a given file has already been included.
$ENV {expr} The hash %ENV contains your current environment. Setting a value in ENV changes the environment for child processes.
$SIG {expr} The hash %SIG is used to set signal handlers for various signals.
Environment Variables
These are available as the '%ENV' hash, and retrieved as follows:
$variable = $ENV{'variable'};
The following are commonly used:
CONTENT_LENGTH The number of bytes of data passed through standard input via the POST method.
DOCUMENT_ROOT Path on the server to the web site (root URL) being accessed.
GATEWAY_INTERFACE Protocol used to communicate with the server.
HTTP_COOKIE The contents of all cookies that are visible to the script - each cookie delimited by a semicolon (';').
HTTP_USER_AGENT The name (eg. 'Mozilla') and version (eg. '4.03') of the browser used to access the server and the type of platform used by the browser (eg. 'Macintosh;I;PPC').
HTTP_REFERER The URL of the page that was being viewed when the script was accessed, either via a link or by direct entering o fthe URL. Can be used to check that the user has come from a recognised source, to help with security.
QUERY_STRING Holds the data input via the GET method.
REQUEST_METHOD Either "POST" or "GET", depending on what is set on the method attributes of the form tag. NB This value will be "POST" if method="POST", even if some data is passed via GET (eg. data appended directly to the action URL).
The following will cause both methods to be used, even though $REQUEST_METHOD="POST":
openanglebraket form action="cgi/proc?A=1&B=2" method="post" closeanglebraket
SERVER_SOFTWARE Name and version of the web server.
12/23/2008
Great htaccess tip for web masters!
These are one of the best tips and tricks involving .htaccess capabilities listed in 16 Useful .htaccess Tricks and Hacks For Web Developers! Check it out.
Quote:
1. Creating a custom error page with .htaccess on a linux apache is a very simple task. Using you a text editor like notepad you create an .htaccess files. Custom error pages give your website an professional look and catch those visitors who reach your website following a back link.
ErrorDocument 401 /error/401.php
ErrorDocument 403 /error/403.php
ErrorDocument 404 /error/404.php
ErrorDocument 500 /error/500.php
2. How to set the timezone on your server
SetEnv TZ America/Houston
3. Block IPs Using htaccess
Sometime you need to block certain IPs from accessing your entire site or directory. Its pretty simple task. All you have to do is inside the .htaccess file is put the following code.
allow from all
deny from 145.186.14.122
deny from 124.15
If you use the whole IP or a part of the IP to block and add the new ones in a new line.
When someone trying to access your site from the banned ip they will get a 403 error access forbidden message.
4. SEO Friendly 301 permanent redirects for bad/old links and moved links
Redirect 301 /d/file.html http://www.htaccesselite.com/r/file.html
5. Set the Email Address for the Server Administrator - Using this code you can specifying the default email address for the server administrator.
ServerSignature EMail
SetEnv SERVER_ADMIN default@domain.com
6. Hotlinking protection with .htaccess is very important because anyone can hot link to your images and eat up all your bandwith of your server. The following code will help you to prevent that.
Options +FollowSymlinks
# Protect Hotlinking
RewriteEngine On
RewriteCond %{HTTP_REFERER} !^$
RewriteCond %{HTTP_REFERER} !^http://(www\.)?domainname\.com/ [nc]
RewriteRule .*\.(gif|jpg|png)$ http://domainname.com/img/hotlink_f_o.png [nc]
7. Block all requests from user agent - by creating a perfect .htaccess ban list, you can block all of unwanted user agents that will keep your server load down. Also Check out this interesting thread on webmaster world about the 228 user agents ban list.
## .htaccess Code :: BEGIN
## Block Bad Bots by user-Agent
SetEnvIfNoCase user-Agent ^FrontPage [NC,OR]
SetEnvIfNoCase user-Agent ^Java.* [NC,OR]
SetEnvIfNoCase user-Agent ^Microsoft.URL [NC,OR]
SetEnvIfNoCase user-Agent ^MSFrontPage [NC,OR]
SetEnvIfNoCase user-Agent ^Offline.Explorer [NC,OR]
SetEnvIfNoCase user-Agent ^[Ww]eb[Bb]andit [NC,OR]
SetEnvIfNoCase user-Agent ^Zeus [NC]
Order Allow,Deny
Allow from all
Deny from env=bad_bot
## .htaccess Code :: END
8. Redirect everyone to different site except few IP -If you want to redirect all the visitors to a different IP. Also give access to certain few IPs. You can use the code below
ErrorDocument 403 http://www.youdomain.com
Order deny,allow
Deny from all
Allow from 124.34.48.165
Allow from 102.54.68.123
9. Don’t want to display download request - Usually when you try to download something from a web server you get a request asking whether you want to save the file or open it.
To avoid that you can use the below code on your .htaccess file.
AddType application/octet-stream .pdf
AddType application/octet-stream .zip
AddType application/octet-stream .mov
10. Change the file type - Make any file be a certain kind of file type Makes image.jpg, index.html, default.cgi all act as php
ForceType application/x-httpd-php
SetHandler application/x-httpd-php
11. Block access to your .htaccess file - By adding he following code to your htaccess file will prevent attempts to access your htaccess file. This extra layer of security protects your htaccess file by displaying a 403 error message on the browser.
# secure htaccess file
 order allow,deny
 deny from all
12. Protect access to certain specific file on your server - this can be done by adding the below mentioned code. For example you want to block with the file name default.jpg This will prevent the viewing of this file.
# prevent access of a certain file
 order allow,deny
 deny from all
13. Prevent access to unauthorized browsing - Protecting specific directory browsing can be done by intructing the server to serve a Forbidden and Authorization required message while anyone requests to view that particular directory. Usually if you site doesn’t have a default index page any files within that directory is accessible to the visitors. To avoid that use the following code in the .htaccess file.
# disable directory browsing
Options All -Indexes
14. Setting the default page - You can set the default page of a directory to any page you like. For example in this code the default page is set as about.html instead of index.html
# serve alternate default index page
DirectoryIndex about.html
15. Password protect your directories and files - You can create authentication for certain files and directories from being access. The code has examples of both password protection for a single file and password protection for a entire directory.
# to protect a file
AuthType Basic
AuthName “Prompt”
AuthUserFile /home/path/.htpasswd
Require valid-user
# password-protect a directory
resides
AuthType basic
AuthName “This directory is protected”
AuthUserFile /home/path/.htpasswd
AuthGroupFile /dev/null
Require valid-user
16. Redirect an old domain to a new domain - Using htaccess file you can redirect a old domain name to a new domain by adding the following code into the htaccess file. Basically what it does is it will remap the old domain to the new one.
# redirect from old domain to new domain
RewriteEngine On
RewriteRule ^(.*)$ http://www.yourdomain.com/$1 [R=301,L]
12/11/2008
WinCVS: How to remove sticky tag
I keep on running into this problem. Whenever you submit the file into CVS and force a revision value, it always enforce revision value through sticky tag. The problem with sticky tag is that, when you try to remove the file from CVS, you first need to remove the sticky tag.
How to do this is quite simple. In WinCVS, you first do update by "Update settings" where under tab "Update options" select "Reset and sticky tags/date/kopts". This will remove any existing sticky tags. Then you can "Modify" -> "Remove", then Commiting the file will remove the file from CVS.
12/07/2008
Free online Python programming guides
Erica put together a great Python tutorial site information. If you want to learn Phthon, this can point you to where to start:
Getting a grip on Python: six ways to learn online
Article quote below:
Online Python tutorials
Official Python Tutorial It's hard to go wrong when Python.org provides the tutorial for you. The official tutorial offers an excellent language overview with all the details you could hope for. That being said, the tutorial reads like a language manual, which it is. This may be exactly what you're looking for or something you'd prefer to avoid.
People with passive-voice allergies are advised to grab some Claritin before reading. Here's an actual quote from the write-up "Perhaps the most well-known statement type is the if statement. For example: There can be zero or more elif parts, and the else part is optional. The keyword ‘elif‘ is short for ‘else if’, and is useful to avoid excessive indentation. An if ... elif ... elif ... sequence is a substitute for the switch or case statements found in other languages."
Strengths: Complete and correct coverage.
Weaknesses: Not especially user friendly introduction.
Python Rocks! Kent S. Johnson provides a terrific overview of the Python language—and why you should be excited by it—in his "Python Rocks!" rant on his personal website. His brief language tour covers a lot of the language highlights for anyone who wants to understand the big Python picture before settling down to a core Python tutorial. It's a great place to start to get you in the mood for learning the language.
Strengths: Helps you understand why Python rocks.
Weaknesses: Short, not a full language overview.

Dive Into Python Mark Pilgrim's online book offers a highly regarded survey of the language. First published in 2004, Dive Into Python is considered one of the best comprehensive overviews by some of our Ars staffers. Presented in outline format, the book covers language basics including statements, data types, objects, regular expressions and more. If you have the time to spare, this book offers exhaustive detail. The last chapter, which covers performance tuning, looks like a real gem for advanced programmers.
Strengths: Really detailed
Weaknesses: Slightly dated, with noticeable typos.
A Byte of Python Swaroop C H's online book offers many, many little knowledge chunks. Each page offers a tiny bit of Python knowledge, with clean formatting and good examples. It is not, however, a book that you'll want to sit and read through as there's little narrative flow from this Yahoo! employee. Instead, it works well as a reference. Click through to the if statement, for example, to find out how to put this one statement together or to the tuple page to see examples of grouped data elements.
Strengths: Just the facts.
Weaknesses: Just the facts.

Learning With Python (2nd Edition) For the experienced programmer who's looking to get up and going with a language as quickly, Jeffrey Elkner, Allen B. Downey and Chris Meyers' Learning with Python site (aka, "How to Think Like a Computer Scientist") provides a simple data dump. Expressions, functions, conditionals, iteration, strings and more are covered in short, pointed chapters.
Each of the 11 chapters is presented on a single webpage with lots of well-focused sample code. It's a great resource for anyone who knows object oriented programming and scripting already but needs to quickly produce results in the new language.
Strengths: Direct and to the point; my favorite site
Weaknesses: Misses advanced best practices.

Learning to Program Alan Gauld's "Learning to Program" offers a series of tutorials that assume little or no programming background. Using Python examples, it start with a surey of language basics and then moves on to more advanced topics including event-driven programming and file manipulation, touching on some basic CS introductions to functional programming and recursion.
You'll probably find his "Python in Practice" and "Working with Databases" sections to be valuable, regardless of your background as it covers very practical applied Python. Sadly, his "Writing Web Clients" and "Writing Web Applications" topics are referenced but not available online at this time.
Strengths: Suitable for new programmers
Weaknesses: Some topics are missing in action.

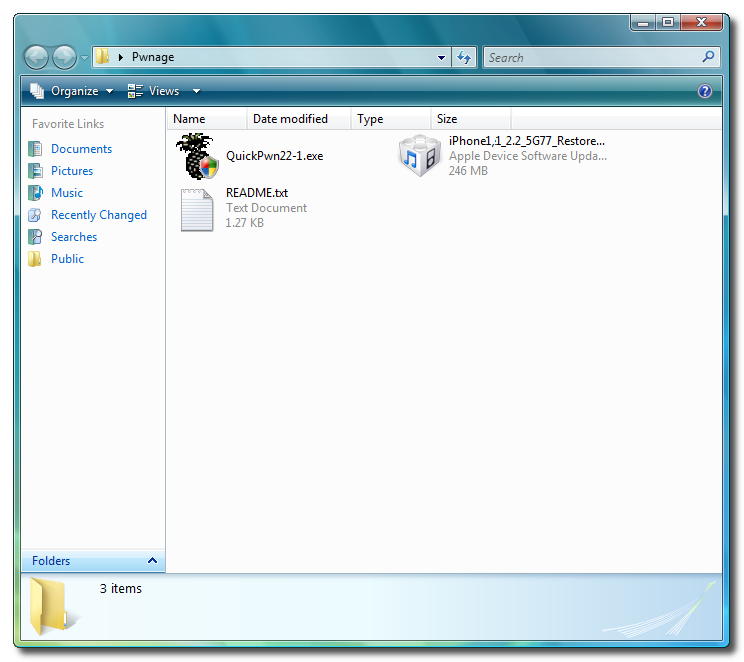
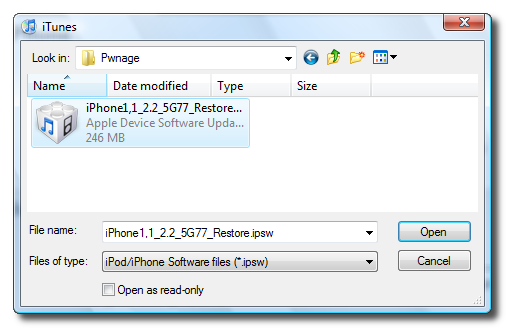
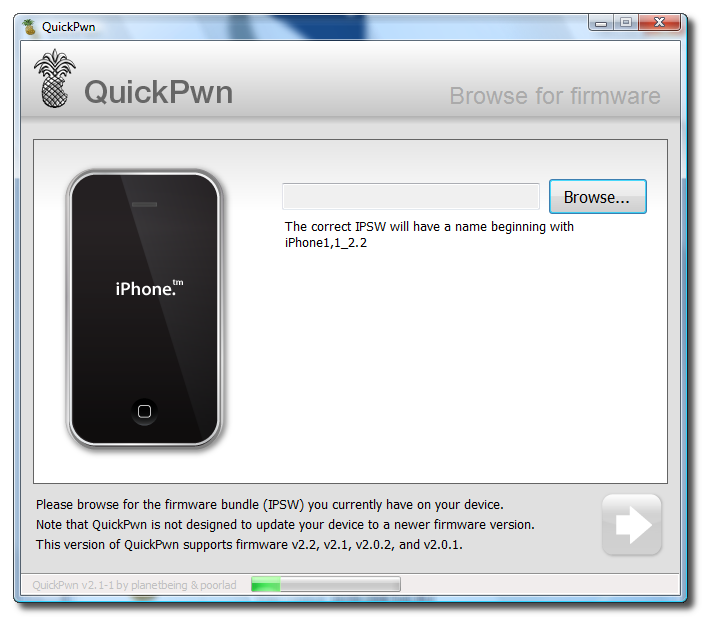
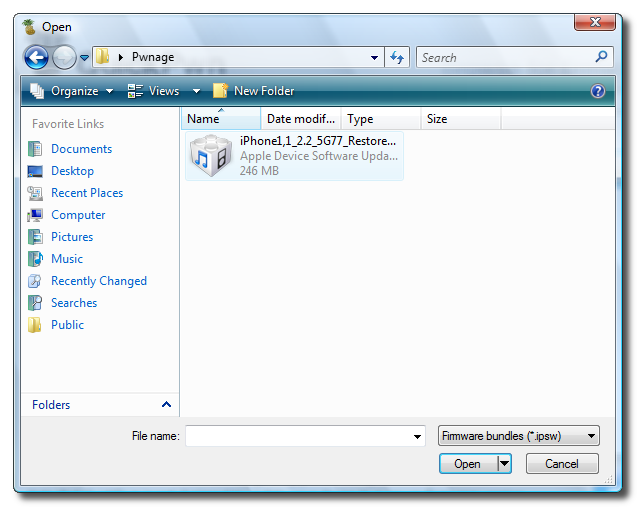
Unlock and Jailbreak your iPhone, DIY style
iClarify has the whole instruction written down to specifics in iPhone | How to Unlock/Jailbreak Your 2.x.x 2G iPhone Using QuickPwn (Windows) article. Very through and easy to follow. Give it a try if you already have iPhone and not yet hacked it. =)
If you are looking for any additional hack or support or updates, macrumors forum provide superb community which provide information for you. Go check it out.
Quoted article below:
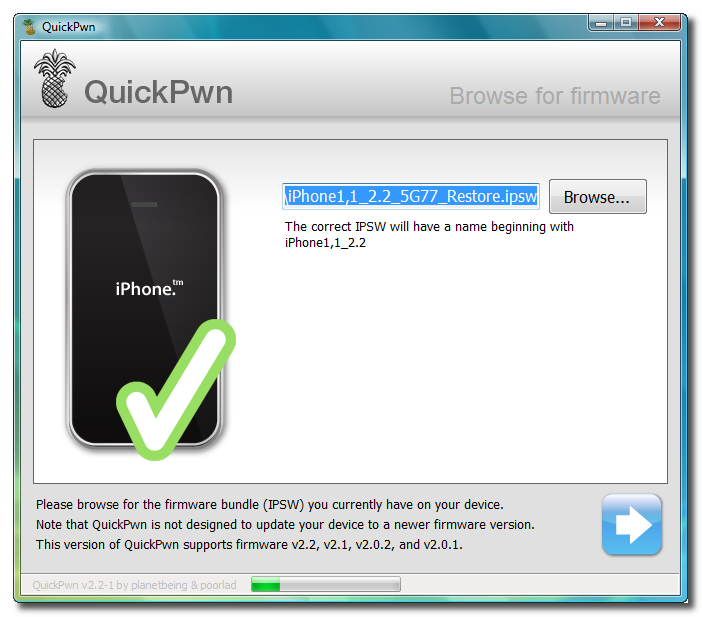
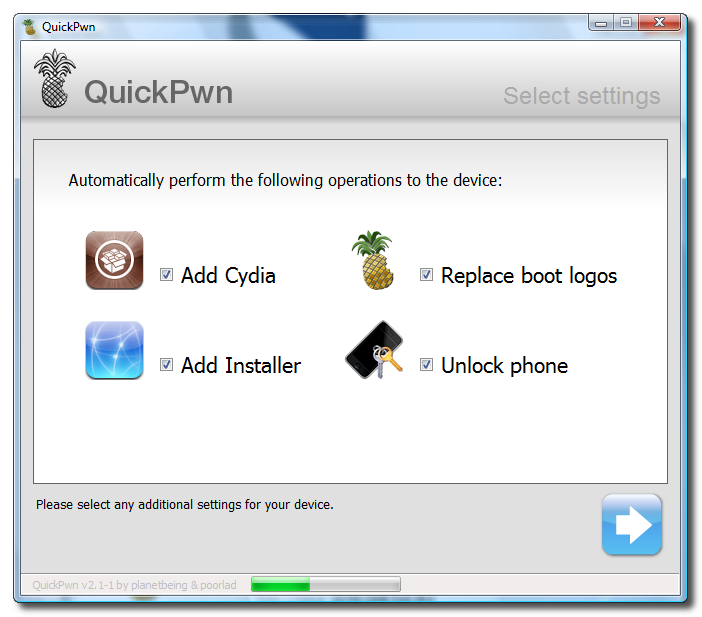
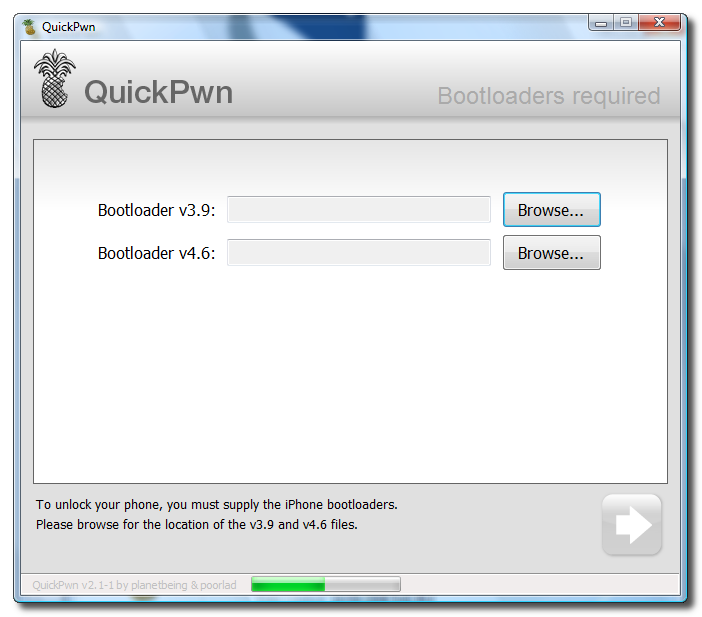
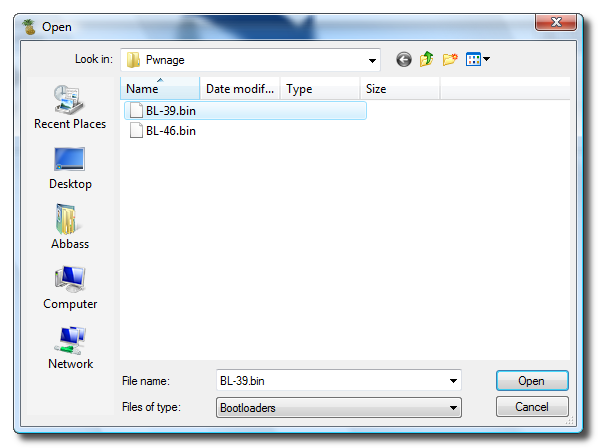
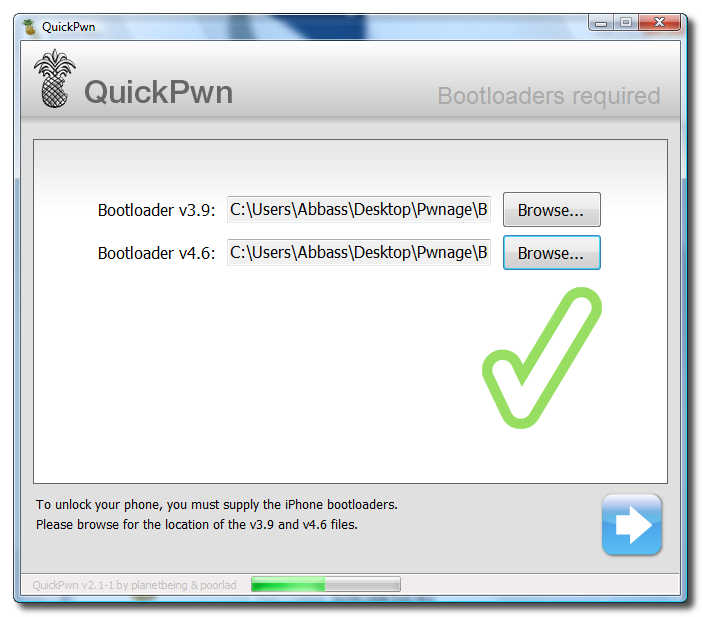
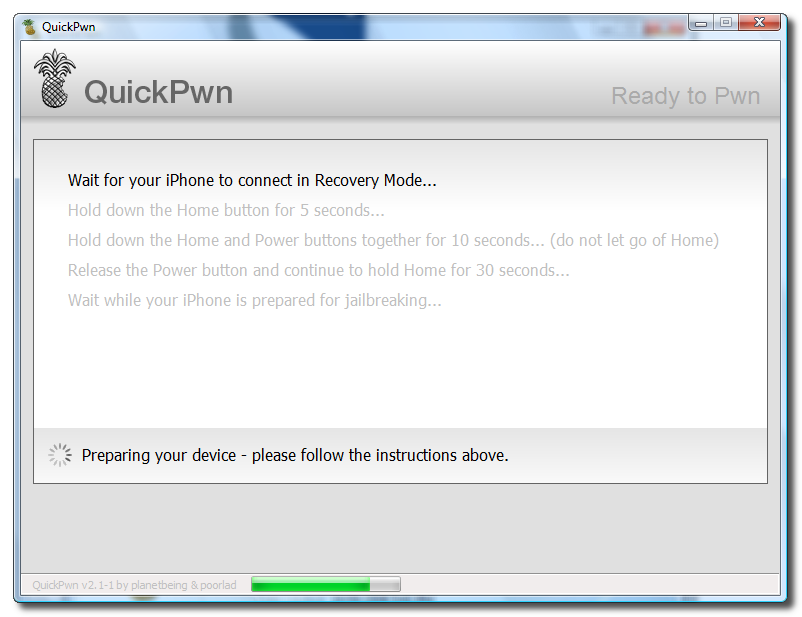
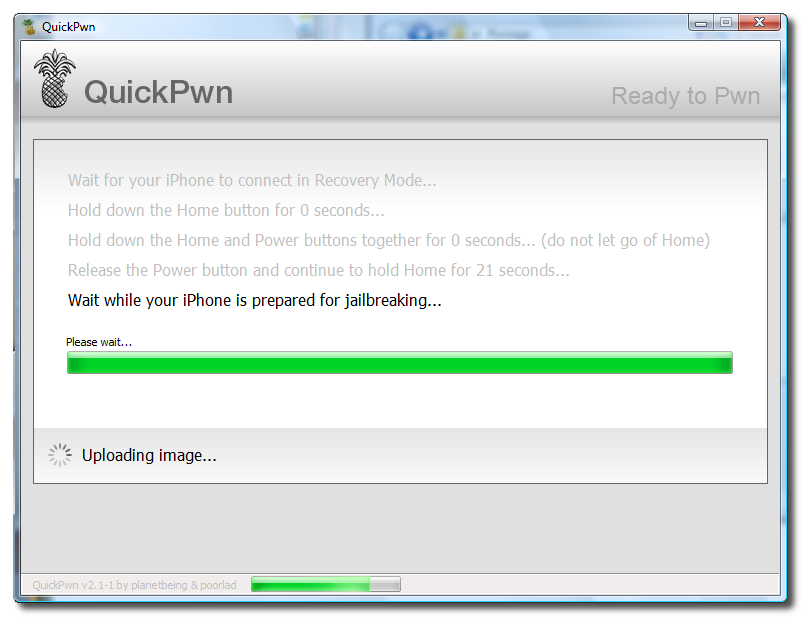
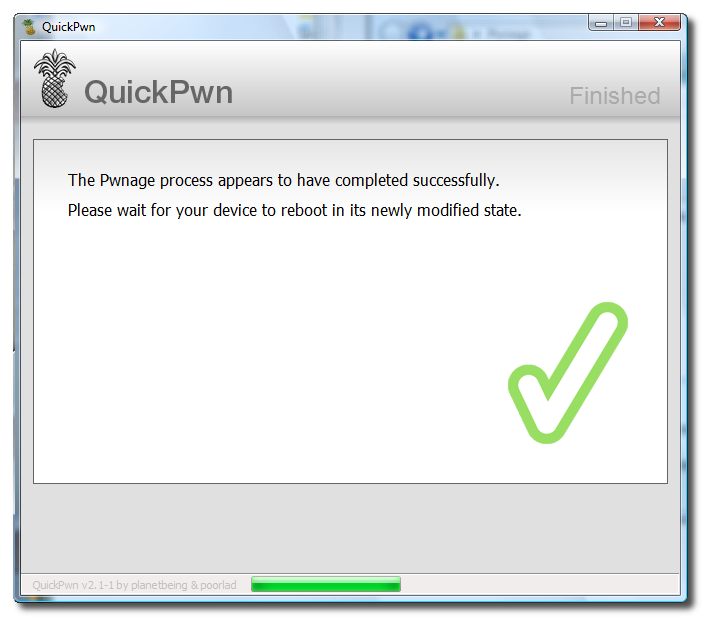
| iPhone | How to Unlock/Jailbreak Your 2.x.x 2G iPhone Using QuickPwn (Windows) | ||
These are instructions on how to unlock/jailbreak your 2G iPhone to the 2.2 iPhone firmware using QuickPwn for Windows. Before beginning make sure you have updated to iTunes 8.0.2. | ||